Como Ler Gráficos de Velas no Mundo Cripto

Principais Resultados
• Os gráficos de velas mostram a movimentação de preços de ativos ao longo do tempo, com dados essenciais como abertura, fechamento, máximo e mínimo.
• A análise em tempo real é crucial no mercado cripto, que opera 24/7 e é altamente volátil.
• Identificar padrões de velas pode ajudar a prever movimentos futuros do mercado e encontrar pontos estratégicos de entrada e saída.
• A segurança dos ativos digitais deve ser uma prioridade, utilizando soluções como carteiras físicas para proteção.
Saber interpretar gráficos de velas — também conhecidos como candlesticks — é fundamental para quem atua no universo das criptomoedas e da tecnologia blockchain. Seja você um iniciante prestes a realizar sua primeira operação ou um investidor experiente em busca de análises mais refinadas, esses gráficos oferecem uma leitura clara da movimentação de preços, revelando o sentimento do mercado e ajudando na tomada de decisões mais estratégicas.
O Que É um Gráfico de Velas Cripto?
O gráfico de velas é uma ferramenta visual que mostra como o preço de um ativo se comportou ao longo de um determinado período. Muito utilizado no mercado cripto pela riqueza de detalhes que oferece, cada vela representa quatro dados essenciais:
- Preço de abertura no início do intervalo
- Preço de fechamento ao fim do período
- Valor máximo alcançado
- Valor mínimo registrado
A parte central e retangular da vela, conhecida como corpo, mostra a diferença entre os preços de abertura e fechamento. Já as linhas finas que se estendem acima e abaixo — chamadas de pavios ou sombras — indicam os extremos atingidos naquele intervalo.
Se o preço fechou acima da abertura, a vela costuma ser verde (ou branca), sinalizando alta. Se fechou abaixo, a vela aparece vermelha (ou preta), indicando queda. Essa estrutura simples, mas poderosa, permite identificar rapidamente a direção do mercado e seu nível de volatilidade (confira o guia da Coinbase sobre gráficos de velas).
Por Que os Gráficos de Velas São Fundamentais no Mercado Cripto?
O mercado cripto opera sem pausas — 24 horas por dia, todos os dias da semana — e é notoriamente volátil. Por isso, a análise em tempo real se torna indispensável. Os gráficos candlestick ajudam você a:
- Visualizar variações de preço em diferentes prazos
- Identificar tendências claras, sejam elas de alta (bullish), baixa (bearish) ou lateralizadas
- Encontrar pontos estratégicos para entrada ou saída, com base em padrões visuais
- Reconhecer zonas críticas de suporte e resistência, essenciais para planejar movimentos
Se quiser se aprofundar na teoria por trás dos candlesticks, vale conferir este artigo na Cryptopedia da Gemini.
Anatomia de uma Vela Cripto
Vamos detalhar os componentes principais:
- Corpo: Representa a diferença entre o preço de abertura e o de fechamento.
- Pavios (ou sombras): Mostram os valores extremos — máximo e mínimo — atingidos no período.
- Cor: Verde quando o preço sobe (fechamento maior que a abertura) e vermelha quando cai (fechamento menor que a abertura).
Exemplo prático: imagine um gráfico do Bitcoin com velas de quatro horas. Se o preço abriu em US$ 90.000 e fechou em US$ 93.500, com uma máxima em US$ 95.000 e mínima em US$ 88.700, teremos uma vela verde com corpo entre US$ 90.000 e US$ 93.500, e pavios se estendendo até os extremos superior e inferior mencionados (veja o guia para iniciantes do Cointelegraph).
Identificando Tendências e Padrões
Mais importante do que analisar velas isoladas é entender os padrões que elas formam ao longo do tempo — muitos deles com potencial preditivo sobre os próximos movimentos do mercado:
- Tendência de alta: Sucessão de velas verdes com topos e fundos ascendentes
- Tendência de baixa: Sequência contínua de velas vermelhas com topos e fundos descendentes
- Fase de consolidação: Velas pequenas com pavios longos, indicando lateralização do preço
Padrões clássicos como engolfo, martelo, estrela cadente ou doji ajudam a antecipar possíveis reversões ou mudanças na força compradora ou vendedora. O "doji", por exemplo — quando abertura e fechamento quase coincidem — costuma sinalizar indecisão no mercado, podendo anteceder movimentos fortes (confira o guia completo da Gemini sobre padrões candlestick).
Por Que Isso Importa Ainda Mais em 2025?
Com o amadurecimento do setor cripto e a entrada crescente de investidores institucionais, dominar ferramentas como os gráficos candlestick nunca foi tão relevante. Em 2025, num cenário com regras mais claras e maior adesão popular, tanto traders profissionais quanto investidores casuais estão recorrendo à análise técnica para ganhar vantagem competitiva.
De acordo com uma reportagem recente do Cointelegraph, interpretar gráficos candlestick segue sendo uma habilidade essencial para navegar pelas fortes altas (rallies) ou correções intensas que caracterizam esse mercado dinâmico.
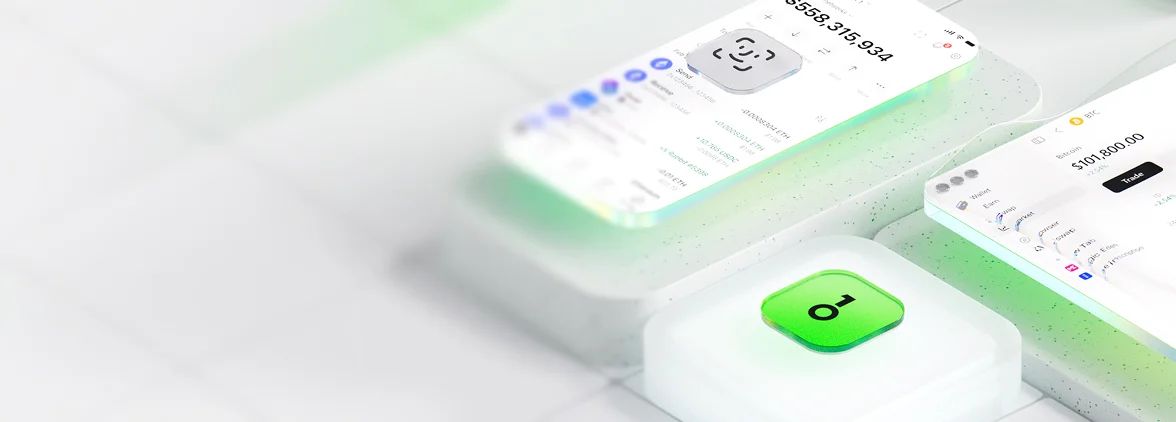
Segurança: Um Pilar Essencial Para Todo Trader
Entender os gráficos é um passo importante — mas proteger seus ativos digitais continua sendo prioridade máxima. Soluções como a carteira física OneKey oferecem armazenamento offline seguro, mantendo seus fundos longe das ameaças digitais como phishing ou malwares.
Se você acompanha gráficos com frequência e realiza operações regulares, unir uma boa leitura técnica à segurança reforçada por uma carteira física pode fazer toda a diferença.
A OneKey foi desenvolvida para integração fluida com protocolos DeFi, compatível com diversas blockchains, sendo ideal tanto para iniciantes quanto usuários mais avançados que desejam proteger seus ativos enquanto operam ativamente no ecossistema cripto.
Para se aprofundar na leitura gráfica e nas melhores práticas para segurança digital, recomendamos os tutoriais especializados da Coinbase e as análises completas disponíveis na Gemini Cryptopedia.
Com domínio dos gráficos candlestick aliado à proteção oferecida por soluções como a OneKey, você estará preparado para explorar — com confiança e segurança — todas as possibilidades oferecidas pelo universo das criptomoedas.